Essay
Use the following information to answer Questions .
The scatterplot below shows the relationship between the average monthly temperature and the
monthly cost of a gas bill. The correlation coefficient between the values is −0.92. 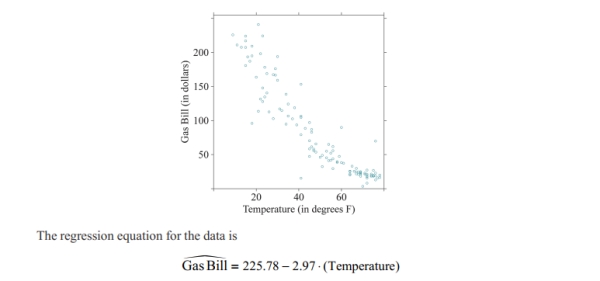
-If appropriate, calculate the expected gas bill cost for a month with an average temperature of −  . If it's not appropriate, explain why.
Correct Answer:

Verified
Correct Answer:
Verified
Q1: Use the following information for following questions
Q3: Use the following information for following questions
Q4: Use the following information for following questions
Q5: Which scatterplot below depicts a stronger linear
Q6: Given the following scatterplot, if a point
Q7: [Objective: Determine the effects of outliers on
Q8: Use the following regression equation regarding professor
Q9: Use the following information for following questions
Q10: A study about high school student SAT
Q11: Use the following information for following questions:.<br>The