Essay
Use the following information for following questions .
The following scatterplot shows the relationship between heights (in cm) and weights (in kg) of 100
Americans. The coefficient of determination was found to be 37.9%. 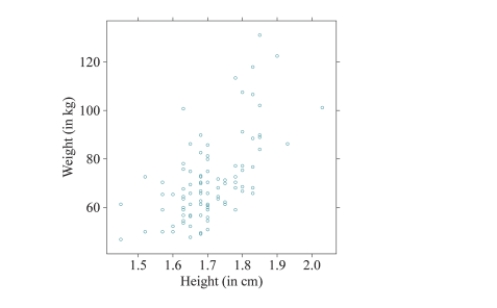
-If we converted the x- axis to inches, instead of centimeters, what would happen to the value of the correlation coefficient?
Correct Answer:

Verified
Correct Answer:
Verified
Q1: Use the following information for following questions
Q2: Use the following information to answer Questions
Q4: Use the following information for following questions
Q5: Which scatterplot below depicts a stronger linear
Q6: Given the following scatterplot, if a point
Q7: [Objective: Determine the effects of outliers on
Q8: Use the following regression equation regarding professor
Q9: Use the following information for following questions
Q10: A study about high school student SAT
Q11: Use the following information for following questions:.<br>The