Essay
Order the following histograms from least to most variability. Explain your reasoning. 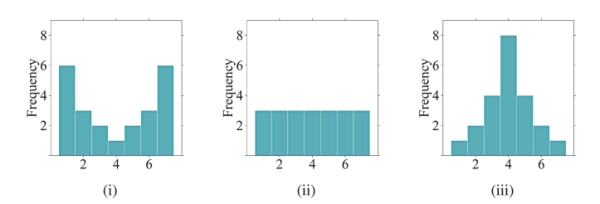
Correct Answer:

Verified
Least to most variability: (iii), (ii), ...View Answer
Unlock this answer now
Get Access to more Verified Answers free of charge
Correct Answer:
Verified
Least to most variability: (iii), (ii), ...
View Answer
Unlock this answer now
Get Access to more Verified Answers free of charge
Related Questions
Q1: What does it mean to find the
Q2: The following histogram represents the movie runtimes
Q3: Which of the following would likely show
Q5: When examining distributions of numerical data, what
Q6: The two histograms below display the exact
Q7: How is a dotplot similar to a
Q8: What information is NOT explicitly portrayed in
Q9: Order the following histograms from most to
Q10: What is the difference between a bar
Q11: If you were to create a dotplot