Multiple Choice
Which dotplot represents the same data as the histogram shown below? 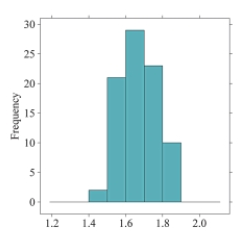
A) 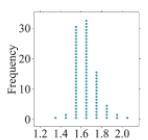
B) 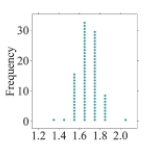
C) 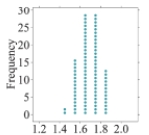
D) 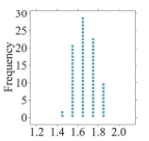
Correct Answer:

Verified
Correct Answer:
Verified
Related Questions
Q23: Use the following information to answer questions
Q24: for following questions , match one of
Q25: The following histogram represents the number of
Q26: Use the following information to answer questions
Q27: The two histograms below display the exact
Q29: Which histogram represents the same data as
Q30: When examining distributions of numerical data, what
Q31: Which statement below is NOT supported by
Q32: What is the difference between a bar
Q33: When examining distributions of numerical data, what