Multiple Choice
The two histograms below display the exact same data. How do the plots differ? 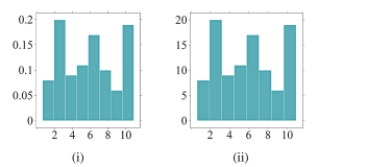
A) Histogram (i) uses frequencies to simply count the number of observations at a given value. Histogram (ii) uses relative frequencies to show the proportion of observations at a given value.
B) Histogram (i) uses relative frequencies to show the proportion of observations at a given value.Histogram (ii) uses frequencies to simply count the number of observations at a given
Value.
C) Histograms (i) and (ii) are exactly the same; there are no differences between the plots.
D) Histograms (i) and (ii) do not display the same data because the values listed on the y-axis do not match.
Correct Answer:

Verified
Correct Answer:
Verified
Q22: The bar charts below depict the marital
Q23: Use the following information to answer questions
Q24: for following questions , match one of
Q25: The following histogram represents the number of
Q26: Use the following information to answer questions
Q28: Which dotplot represents the same data as
Q29: Which histogram represents the same data as
Q30: When examining distributions of numerical data, what
Q31: Which statement below is NOT supported by
Q32: What is the difference between a bar