Essay
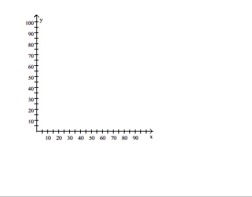
Plot and interpret the appropriate scatter diagram.
-The one-day temperatures for 12 world cities along with their latitudes are shown in the table below. Make a
scatter diagram for the data. Describe what happens to the one-day temperatures as the latitude increases. Latitude (degrees)  Temperature (F)°
Correct Answer:

Verified
Latitude (degrees)  ...
...View Answer
Unlock this answer now
Get Access to more Verified Answers free of charge
Correct Answer:
Verified
View Answer
Unlock this answer now
Get Access to more Verified Answers free of charge
Q145: Determine the slope and y-intercept of the
Q146: Solve the problem.<br>-Marty's Tee Shirt & Jacket
Q147: Determine whether the given function is
Q148: Find the real zeros of the
Q149: Find the zero of the linear
Q151: Determine the slope and y-intercept of the
Q152: Find the real zeros, if any,
Q153: Determine if the type of relation is
Q154: Find the real zeros, if any,
Q155: Solve the problem.<br>-The following scatter diagram