Multiple Choice
Solve the problem.
-The following scatter diagram shows heights (in inches) of children and their ages. 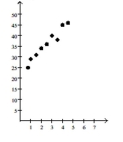
Age (years) Based on this data, how old do you think a child is who is about 39 inches tall?
A) 1 year
B) 7 years
C) 3 months
D) 3 years
Correct Answer:

Verified
Correct Answer:
Verified
Related Questions
Q150: Plot and interpret the appropriate scatter
Q151: Determine the slope and y-intercept of the
Q152: Find the real zeros, if any,
Q153: Determine if the type of relation is
Q154: Find the real zeros, if any,
Q156: Use the slope and y-intercept to
Q157: Find the zero of the linear function.<br>-f(x)
Q158: Use a graphing utility to find the
Q159: Find the zero of the linear
Q160: Solve the problem.<br>-The following data represents