Multiple Choice
The graph below is of a normal curve. The shaded portion of the graph represents 68% of the total area under the curve. According to the graph, what is the value of the 97.5th percentile P97.5 ?
A) 2
B) 3
C) 12
D) 35
E) None of the above. 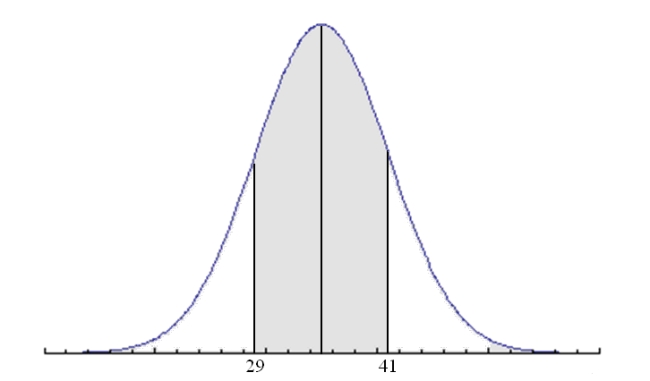
Correct Answer:

Verified
Correct Answer:
Verified
Related Questions
Q2: An honest six-sided die is tossed a
Q3: The graph below is of a normal
Q4: In a normal distribution with a standard
Q5: A normal distribution has a mean of
Q6: After finishing college, you start working as
Q7: An honest six-sided die is tossed a
Q8: The actual weight of the contents of
Q9: The height of an 18-year old student
Q10: After several weeks of compiling data you
Q11: In a normal distribution with a standard