Essay
The box-plot shown below was constructed from data regarding the annual salaries of both Opera
singers and Country Western singers. 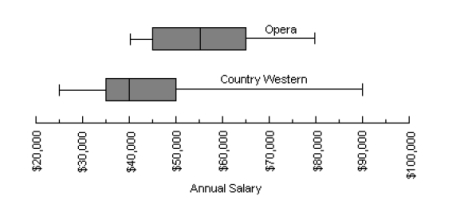 Based on the graph above, is there a larger proportion of Opera singers or a larger proportion of Country Western singers with a salary range above $50,000? Explain.
Correct Answer:

Verified
There is a larger proportion of Opera
Si...View Answer
Unlock this answer now
Get Access to more Verified Answers free of charge
Correct Answer:
Verified
Si...
View Answer
Unlock this answer now
Get Access to more Verified Answers free of charge
Q10: The members of the golf club at
Q11: You and several friends in your dorm
Q12: In order to qualify for the game
Q13: The histogram shown below gives the final
Q14: The pie-chart shown below gives the responses
Q16: You and several friends in your dorm
Q17: The members of the golf club at
Q18: The histogram shown below gives the annual
Q19: You and several friends in your dorm
Q20: The pie-chart shown below gives the responses