Short Answer
The pie-chart shown below gives the responses answered on Question 12 of a recent Finite Math final exam. The question was a multiple choice question with options (A, B, C, D, or E). Assuming that the graph was created correctly, what number of responses had option D as the choice? Note that the angle measures for each pie slice are given. 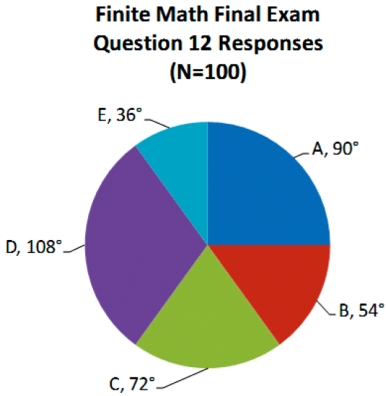 (a) 30
(b) 36
(c) 60
(d) 108
(e) None of the above.
Correct Answer:

Verified
Correct Answer:
Verified
Q15: The box-plot shown below was constructed from
Q16: You and several friends in your dorm
Q17: The members of the golf club at
Q18: The histogram shown below gives the annual
Q19: You and several friends in your dorm
Q21: The box-plot shown below was constructed from
Q22: The data shown below represents the annual
Q23: The data shown below represents the annual
Q24: In order to qualify for the game
Q25: In order to qualify for the game