Short Answer
The pie-chart shown below gives the responses answered on Question 12 of a recent Finite Math final exam. The question was a multiple choice question with options (A, B, C, D, or E). Assuming that the graph was created correctly, what number of responses had option B as the choice? Note that the angle measures for each pie slice are given. 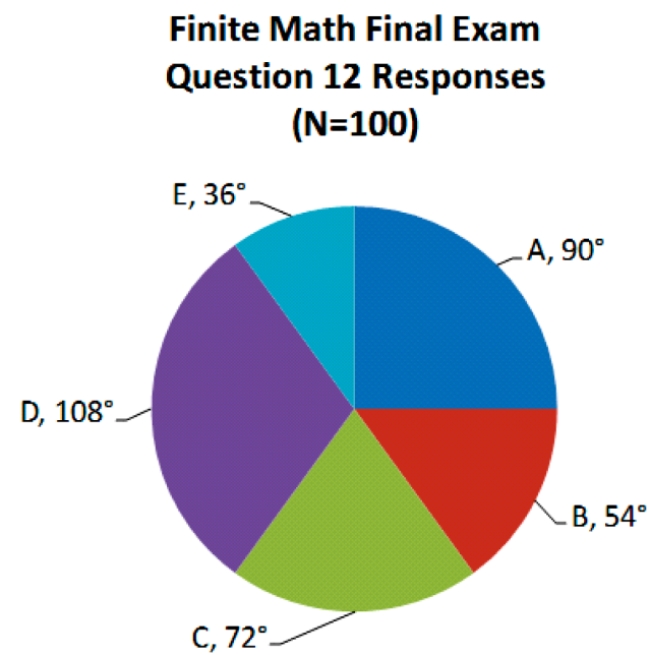
Correct Answer:

Verified
Correct Answer:
Verified
Q3: In order to qualify for the game
Q4: The members of the golf club at
Q5: Refer to the situation in problem 7;
Q5: Refer to the situation in problem 7;
Q7: The histogram shown below gives the annual
Q9: You and several friends in your dorm
Q10: The members of the golf club at
Q11: You and several friends in your dorm
Q12: In order to qualify for the game
Q13: The histogram shown below gives the final