Multiple Choice
The histogram shown below gives the annual income of 35 recent college graduates. 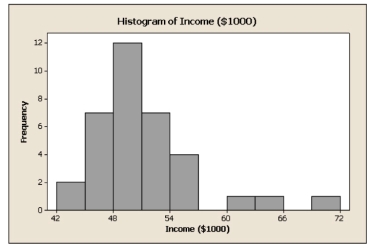
-Refer to the situation in above ; based on the shape of the histogram, which of the following is the best answer?
A) median is less than the mean
B) median is greater than the mean
C) median is roughly equivalent than the mean
D) median is greater than $60000
E) None of the above.
Correct Answer:

Verified
Correct Answer:
Verified
Q2: You and several friends in your dorm
Q3: In order to qualify for the game
Q4: The members of the golf club at
Q5: Refer to the situation in problem 7;
Q5: Refer to the situation in problem 7;
Q8: The pie-chart shown below gives the responses
Q9: You and several friends in your dorm
Q10: The members of the golf club at
Q11: You and several friends in your dorm
Q12: In order to qualify for the game