Multiple Choice
A project consists of seven tasks labeled A through G . The table shown below gives the processing times and precedence relations. Which project digraph represents this situation?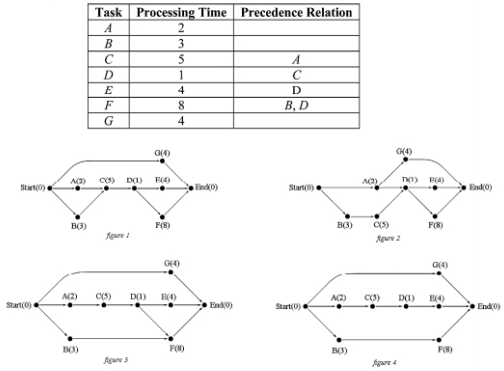
A) figure 1
B) figure 2
C) figure 3
D) figure 4
E) None of the above.
Correct Answer:

Verified
Correct Answer:
Verified
Q1: Suppose that you work at a local
Q2: Suppose that you work at a local
Q4: <img src="https://d2lvgg3v3hfg70.cloudfront.net/TB34225555/.jpg" alt=" -Consider the digraphs
Q5: A project consists of seven tasks labeled
Q6: Consider the project digraph shown below; apply
Q7: Suppose that you work at a local
Q8: <img src="https://d2lvgg3v3hfg70.cloudfront.net/TB6029/.jpg" alt=" -Consider the digraphs
Q9: <img src="https://d2lvgg3v3hfg70.cloudfront.net/TB6029/.jpg" alt=" -Consider the digraph
Q10: A project consists of seven tasks labeled
Q11: Consider the digraph with vertex set V