Multiple Choice
This graph shows an interpretation of temperatures based on tree-ring data. This graph implies that: 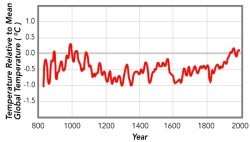
A) current temperatures are by far the hottest in this record
B) atmospheric warming started well before 1900
C) climate was stable prior to 1800
D) all of these
Correct Answer:

Verified
Correct Answer:
Verified
Q78: Wind moves sediment by:<br>A) bouncing sand grains
Q79: This figure shows warmer-than-normal sea-surface temperatures in
Q80: Which of the following is a key
Q81: As described in the chapter opener, the
Q82: Which of the following is NOT a
Q84: Atmospheric pressure is generally:<br>A) lower at lower
Q85: For these ocean currents in the Atlantic,
Q86: What location on this map is closest
Q87: Which of the following helps cause hurricanes
Q88: The accompanying graph shows the number of