Multiple Choice
The accompanying graph shows the number of violent tornados in the last 60 years. Based on when most global warming has occurred, one would conclude: 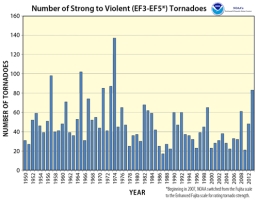
A) global warming has had a major impact on the number of tornados.
B) global warming has had a major impact on the number of tornados in the early part of the century.
C) global warming has had a major impact on the number of tornados since 2000.
D) global warming has not had an impact on the number of tornados.
Correct Answer:

Verified
Correct Answer:
Verified
Q83: This graph shows an interpretation of temperatures
Q84: Atmospheric pressure is generally:<br>A) lower at lower
Q85: For these ocean currents in the Atlantic,
Q86: What location on this map is closest
Q87: Which of the following helps cause hurricanes
Q89: For these ocean currents in the Atlantic,
Q90: This figure shows warmer-than-normal sea-surface temperatures in
Q91: Which of the following is true about
Q92: Which of the following sites on this
Q93: The Coriolis effect causes wind to have