Multiple Choice
This graph shows one estimate of average air temperatures. This graph indicates that: 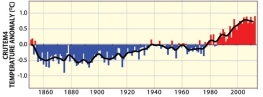
A) humans and greenhouse gases are responsible for global warming
B) overall, air temperatures have been increasing since around 1910
C) Earth was warmer in the late 1800s than it was in the late 1900s
D) all of these
Correct Answer:

Verified
Correct Answer:
Verified
Q96: These pillars are remnants of layers, most
Q97: Most equatorial regions are warmer than the
Q98: The thermohaline conveyor is driven by:<br>A) warm,
Q99: Based on data collected in Hawaii, since
Q100: This graph shows an interpretation of temperatures
Q102: In the Northern Hemisphere, most surface current
Q103: All of the following are cold currents,
Q104: Which of the following is true about
Q105: Where do most deserts and other arid
Q106: How do rain forests influence ecology?<br>A) materials