Multiple Choice
This graph shows an interpretation of temperatures based on the lengths of glaciers. This graph indicates that: 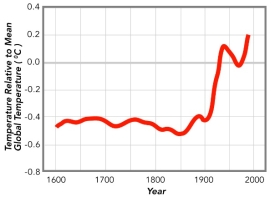
A) climate has been changing over the past hundred years
B) overall, air temperatures have been increasing since around 1900
C) from 1600 to 1900 the Earth was dramatically colder than it has been since 1900
D) all of these
Correct Answer:

Verified
Correct Answer:
Verified
Q95: The tropics are regions characterized by:<br>A) high-pressure
Q96: These pillars are remnants of layers, most
Q97: Most equatorial regions are warmer than the
Q98: The thermohaline conveyor is driven by:<br>A) warm,
Q99: Based on data collected in Hawaii, since
Q101: This graph shows one estimate of average
Q102: In the Northern Hemisphere, most surface current
Q103: All of the following are cold currents,
Q104: Which of the following is true about
Q105: Where do most deserts and other arid