Multiple Choice
Solve the problem.
-When exposed to ethylene gas, green bananas will ripen at an accelerated rate. The number of days for ripening becomes shorter for longer exposure times. Assume that the table below gives average ripening times of
Bananas for several different ethylene exposure times. Plot the data and then find a line approximating the data. With the aid of this line, determine the rate of change of
Ripening time with respect to exposure time. Round your answer to two significant digits. 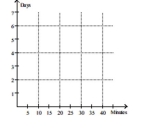
A) 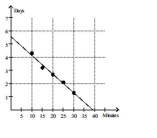
day per minute
B) 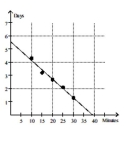
38 minutes
C) 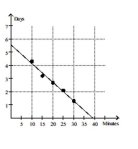
-6.7 davs per minute
D) 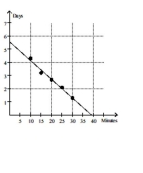
davs
Correct Answer:

Verified
Correct Answer:
Verified
Q294: Find the limit.<br>- <span class="ql-formula" data-value="\lim
Q295: Answer the question.<br>-Does <span class="ql-formula"
Q296: Find the limit, if it exists.<br>-
Q297: Find the limit and determine if
Q298: <span class="ql-formula" data-value="\text { Find the limit
Q300: Find the intervals on which the
Q301: Find the limit.<br>- <span class="ql-formula" data-value="\lim
Q302: Find the limit.<br>- <span class="ql-formula" data-value="\lim
Q303: Find the limit, if it exists.<br>-
Q304: For the function f whose graph