Multiple Choice
Solve the problem.
- 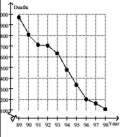
Estimate the average rate of change in tuberculosis deaths from 1996 to 1998.
A) About -0.5 deaths per year
B) About -90 deaths per year
C) About -50 deaths per year
D) About -20 deaths per year
Correct Answer:

Verified
Correct Answer:
Verified
Related Questions
Q308: Provide an appropriate response.<br>-If <span
Q309: Graph the rational function. Include the
Q310: Use a CAS to plot the
Q311: Find the limit.<br>- <span class="ql-formula" data-value="\lim
Q312: Find the limit and determine if
Q314: Find the limit.<br>- <span class="ql-formula" data-value="\lim
Q315: <span class="ql-formula" data-value="\text { Use the graph
Q316: Use the table of values of
Q317: Graph the rational function. Include the
Q318: Solve the problem.<br>-The current in a