Multiple Choice
The figure shows the graphs of the cost and revenue functions for a company that manufactures and sells
binoculars. Use the information in the figure to answer the question.
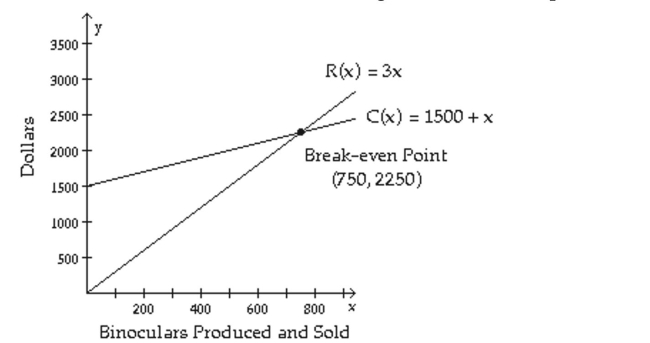
-How many binoculars must be produced and sold for the company to break even?
A) 750 binoculars
B) 2250 binoculars
C) 1500 binoculars
D) 2700 binoculars
Correct Answer:

Verified
Correct Answer:
Verified
Q222: Solve the system of equations by
Q223: Solve the problem.<br>-Jamil always throws loose change
Q224: Determine whether the given ordered pair
Q225: Solve Nonlinear Systems By Addition<br>Solve the
Q226: Solve the problem.<br>-Johnny's cafe serves desserts. One
Q228: The figure shows the graphs of the
Q229: Solve the system by the method
Q230: Solve the problem.<br>-In a 1-mile race, the
Q231: Decompose P/Q, Where Q Has a
Q232: Graph the inequality.<br>- <span class="ql-formula" data-value="y