Multiple Choice
The figure shows the graphs of the cost and revenue functions for a company that manufactures and sells
binoculars. Use the information in the figure to answer the question.
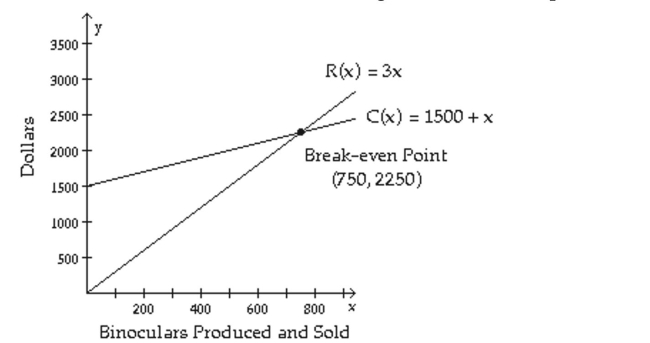
-Is there a profit when 947 binoculars are produced?
A) Yes
B) No
Correct Answer:

Verified
Correct Answer:
Verified
Related Questions
Q206: Solve Nonlinear Systems By Addition<br>Solve the
Q207: The figure shows the graphs of the
Q208: Solve the system by the substitution
Q209: Solve the problem.<br>-In 1985, in the
Q210: Solve the problem.<br>-A dietitian needs to
Q212: Graph the inequality.<br>- <span class="ql-formula" data-value="(
Q213: Solve the system of equations by
Q214: Solve the system of equations by
Q215: Graph the solution set of the
Q216: Solve the problem.<br>-A dietitian needs to