Multiple Choice
The figure shows the graphs of the cost and revenue functions for a company that manufactures and sells
binoculars. Use the information in the figure to answer the question.
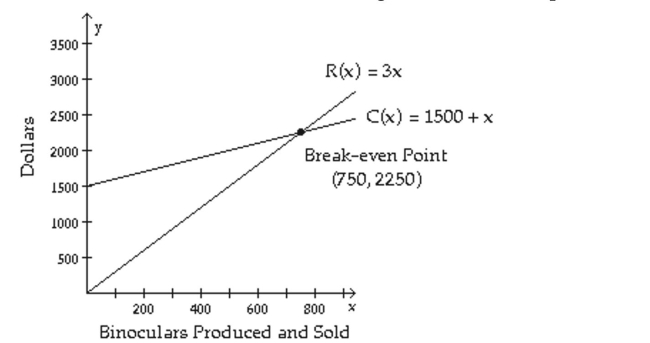
-Use the revenue and cost functions to write the profit function from producing and selling x binoculars.
A) P(x) = 2x - 1500
B) P(x) = 2x + 1500
C) P(x) = 4x + 1500
D) P(x) = 4x - 1500
Correct Answer:

Verified
Correct Answer:
Verified
Q202: Solve the problem.<br>-A right triangle has an
Q203: Graph the solution set of the
Q204: Solve the problem.<br>-A vineyard produces two special
Q205: Solve the problem.<br>-The liquid portion of
Q206: Solve Nonlinear Systems By Addition<br>Solve the
Q208: Solve the system by the substitution
Q209: Solve the problem.<br>-In 1985, in the
Q210: Solve the problem.<br>-A dietitian needs to
Q211: The figure shows the graphs of the
Q212: Graph the inequality.<br>- <span class="ql-formula" data-value="(