Multiple Choice
The figure shows a molecular-level representation of the following voltaic cell: Mg(s) + Sn2+(aq) Mg2+(aq) + Sn(s) When drawing the "after" representation one would note that: 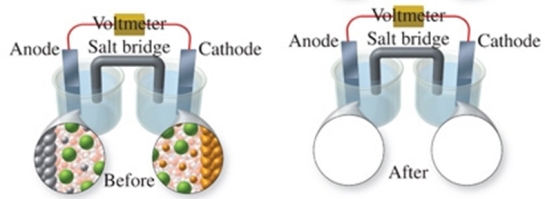
A) the tin electrode will be smaller.
B) the magnesium electrode will be larger.
C) the number of Mg2+ ions in solution will remain constant.
D) deposits will form in the salt bridge.
E) the number of Sn2+ ions in solution will decrease.
Correct Answer:

Verified
Correct Answer:
Verified
Q3: Equations that are written to represent either
Q42: In which of the following choices is
Q70: The products of the electrolysis of molten
Q82: The following reaction occurs in a lead
Q100: Consider the reaction: H<sub>2</sub>O(l) + 3SO<sub>3</sub><sup>2</sup><sup>-</sup>(aq)
Q102: The figure shows the electrolysis of
Q104: Consider the half-reaction NO<sub>3</sub>-(aq) <span
Q105: What are the oxidation numbers of the
Q108: A voltaic cell is prepared in
Q119: Sodium is produced by electrolysis of molten