Multiple Choice
The following display from a graphing calculator presents the least-squares regression line for predicting the price of a certain commodity (y) from the price of a barrel of oil (x) . 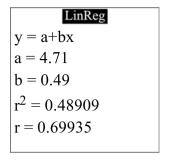 Write the equation of the least-squares regression line.
A) y=4.71+0.48909 x
B) y=4.71+0.49 x
C) y=0.49+0.48909 x
D) y=0.49+4.71 x
Correct Answer:

Verified
Correct Answer:
Verified
Q7: The following table presents the average
Q8: Of points 1, 2, and 3 shown
Q9: Compute the least-squares regression line for
Q10: A blood pressure measurement consists of
Q11: One of the primary feeds for
Q13: The following table shows the per-person
Q14: For the following data set, compute
Q15: The following table lists the heights
Q16: As with many other construction materials,
Q17: For which of the following scatter plots