Multiple Choice
The following display from a graphing calculator presents the least-squares regression line for predicting the price of a certain commodity (y) from the price of a barrel of oil (x) . 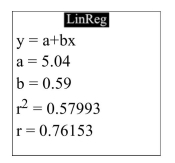 What is the correlation between the oil price and the commodity price?
A) 0.76153
B) 0.59
C) 5.04
D) 0.57993
Correct Answer:

Verified
Correct Answer:
Verified
Related Questions
Q16: As with many other construction materials,
Q17: For which of the following scatter plots
Q18: An automotive engineer computed a least-squares
Q19: The common cricket can be used
Q20: The following table presents the number
Q22: The following MINITAB output presents the
Q23: The common cricket can be used
Q24: One of the primary feeds for
Q25: The common cricket can be used
Q26: One of the primary feeds for