Multiple Choice
Below is a graph of a function . Find the average rate of change in from 4 to 10 . 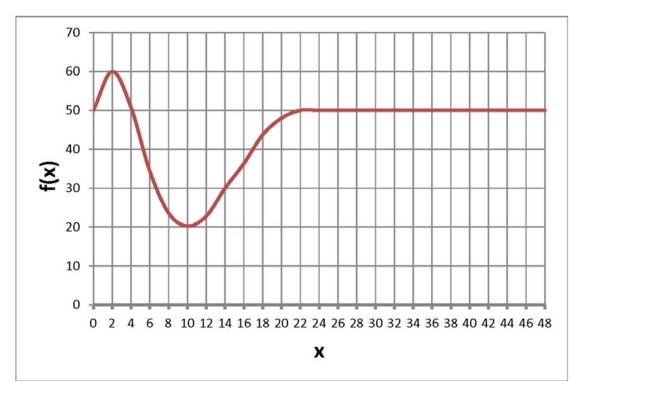
A) 20
B) -5
C) -30
D) None of the above
Correct Answer:

Verified
Correct Answer:
Verified
Related Questions
Q23: Below is a graph of a
Q24: The following table shows average rice
Q25: You put a drink in the freezer
Q26: <span class="ql-formula" data-value="\text { If } g
Q27: The distance, in miles, from me
Q29: The following table shows some function
Q30: <img src="https://d2lvgg3v3hfg70.cloudfront.net/TB3388/.jpg" alt=" A) 7.73
Q31: Sugar costs $1.27 per pound, and
Q32: The following table shows your monthly
Q33: Sugar costs $1.62 per pound, and