Essay
A normal quartile plot is given below for a sample of scores on an aptitude test. Use the plot to assess the
normality of scores on this test. Explain your reasoning. 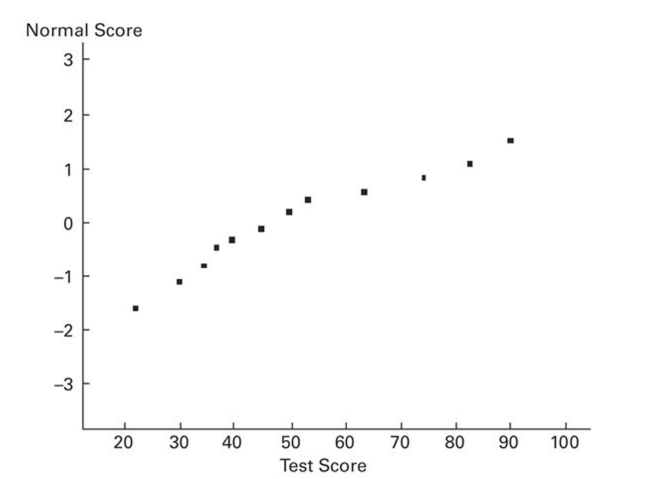
Correct Answer:

Verified
Since the normal quartile plot...View Answer
Unlock this answer now
Get Access to more Verified Answers free of charge
Correct Answer:
Verified
View Answer
Unlock this answer now
Get Access to more Verified Answers free of charge
Q215: Solve the problem.<br>-Assume that z scores
Q216: Which of the following is a biased
Q217: The Precision Scientific Instrument Company manufactures
Q218: Solve the problem.<br>-Tell whether the following statistic
Q219: Estimate the indicated probability by using the
Q221: Assume that <span class="ql-formula" data-value="z"><span
Q222: Find the indicated value.<br>- <span class="ql-formula"
Q223: Solve the problem.<br>-The ages (in years) of
Q224: If z is a standard normal variable,
Q225: The normal distribution has a greater percentage