Multiple Choice
The normal distribution has a greater percentage of its area close to the mean and much less in the tails.
-Find the indicated IQ score. The graph depicts IQ scores of adults, and those scores are normally distributed with a mean of 100 and a standard deviation of 15 (as on the Wechsler test) . 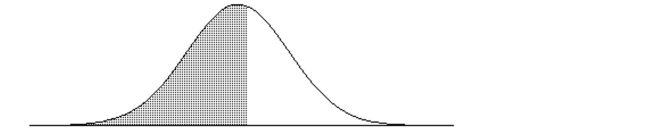 The shaded area under the curve is 0.5675.
A) 97.5
B) 129.6
C) 102.6
D) 110.7
Correct Answer:

Verified
Correct Answer:
Verified
Q26: Three randomly selected households are surveyed as
Q220: A normal quartile plot is given below
Q221: Assume that <span class="ql-formula" data-value="z"><span
Q222: Find the indicated value.<br>- <span class="ql-formula"
Q223: Solve the problem.<br>-The ages (in years) of
Q224: If z is a standard normal variable,
Q226: A baseball player has a batting average
Q228: Assume that X has a normal
Q229: For the binomial distribution with the given
Q230: Solve the problem.<br>-A math teacher gives two