Essay
A normal quartile plot is given below for the weekly incomes (in dollars) of a sample of engineers in one town.
Describe what each x value represents and what each y value represents. Use the plot to assess the normality of
the incomes of engineers in this town. Explain your reasoning. 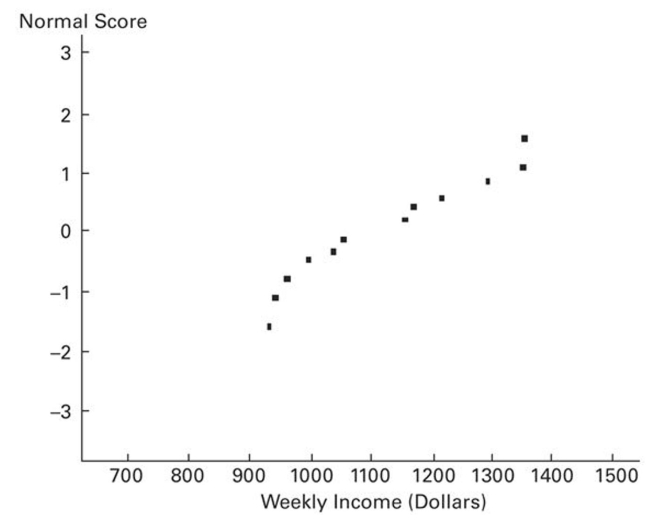
Correct Answer:

Verified
Each x-value is from the original set of...View Answer
Unlock this answer now
Get Access to more Verified Answers free of charge
Correct Answer:
Verified
View Answer
Unlock this answer now
Get Access to more Verified Answers free of charge
Q53: The normal distribution has a greater percentage
Q54: Solve the problem.<br>-A study of the amount
Q55: Estimate the indicated probability by using the
Q56: Solve the problem. Round to the nearest
Q57: Solve the problem.<br>-A poll of 1200 randomly
Q59: If z is a standard normal variable,
Q60: If a sample size is < _,
Q61: If z is a standard normal variable,
Q62: Find the indicated probability.<br>-The diameters of pencils
Q63: Use the normal distribution to approximate the