Multiple Choice
The normal distribution has a greater percentage of its area close to the mean and much less in the tails.
-Find the indicated IQ score. The graph depicts IQ scores of adults, and those scores are normally distributed with a mean of 100 and a standard deviation of 15 (as on the Wechsler test) . 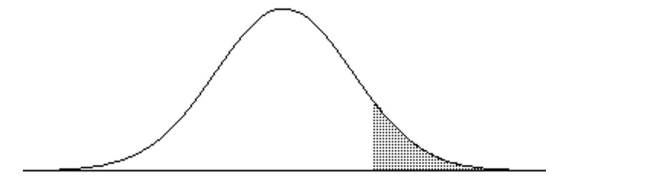 The shaded area under the curve is 0.10.
A) 119.2
B) 80.8
C) 100.5
D) 108.1
Correct Answer:

Verified
Correct Answer:
Verified
Q29: Heights of adult females are normally distributed.
Q48: The continuity correction is used to compensate
Q49: Solve the problem.<br>-The ages of 30
Q51: If z is a standard normal variable,
Q52: Find the indicated probability.<br>-Assume that the weights
Q54: Solve the problem.<br>-A study of the amount
Q55: Estimate the indicated probability by using the
Q56: Solve the problem. Round to the nearest
Q57: Solve the problem.<br>-A poll of 1200 randomly
Q58: A normal quartile plot is given below