Multiple Choice
Find the indicated z score. The graph depicts the standard normal distribution with mean 0 and standard deviation 1.
-Shaded area is 0.4483. 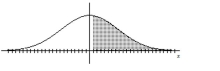
A) 0.6736
B) 0.13
C) -0.13
D) 0.3264
Correct Answer:

Verified
Correct Answer:
Verified
Related Questions
Q9: Three randomly selected households are surveyed as
Q232: What is the probability that the random
Q233: Assume that the weight loss for
Q234: Solve the problem.<br>-A normal quartile plot is
Q235: Find the area of the shaded region.
Q236: What is the probability that the random
Q238: Solve the problem.<br>-Personal phone calls received in
Q240: Solve the problem.<br>-The data below represents
Q241: Solve the problem.<br>-The probability of no more
Q242: Assume that the weight loss for