Essay
Solve the problem.
-A normal quartile plot is given below for a sample of scores on an aptitude test. Use the plot to assess the
normality of scores on this test. Explain your reasoning. 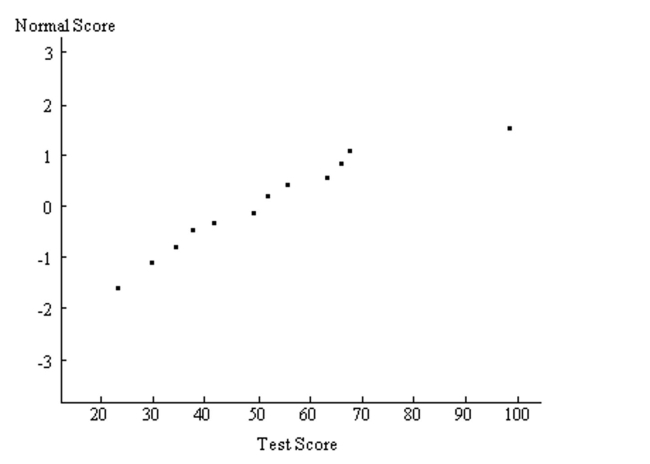
Correct Answer:

Verified
Since the normal quartile plot...View Answer
Unlock this answer now
Get Access to more Verified Answers free of charge
Correct Answer:
Verified
View Answer
Unlock this answer now
Get Access to more Verified Answers free of charge
Q9: Three randomly selected households are surveyed as
Q229: For the binomial distribution with the given
Q230: Solve the problem.<br>-A math teacher gives two
Q231: Solve the problem.<br>-The ages (in years) of
Q232: What is the probability that the random
Q233: Assume that the weight loss for
Q235: Find the area of the shaded region.
Q236: What is the probability that the random
Q237: Find the indicated z score. The graph
Q238: Solve the problem.<br>-Personal phone calls received in