Essay
Solve the problem.
-A normal quartile plot is given below for a sample of scores on an aptitude test. Use the plot to assess the
normality of scores on this test. Explain your reasoning. 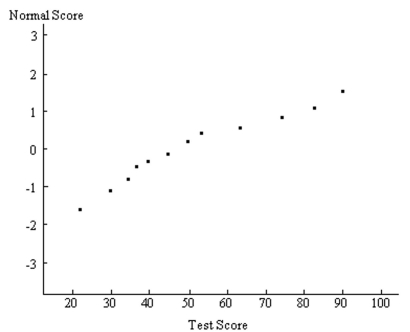
Correct Answer:

Verified
Since the normal quartile plot...View Answer
Unlock this answer now
Get Access to more Verified Answers free of charge
Correct Answer:
Verified
View Answer
Unlock this answer now
Get Access to more Verified Answers free of charge
Q32: After constructing a new manufacturing machine, five
Q244: Estimate the indicated probability by using the
Q245: Find the indicated z score. The graph
Q246: The normal distribution has a greater percentage
Q247: Find the indicated probability.<br>-A bank's loan officer
Q249: Solve the problem.<br>-Suppose that you wish
Q250: Find the indicated probability.<br>-The lengths of human
Q251: Solve the problem.<br>-In a population of
Q252: Find the indicated z score. The graph
Q253: Use the normal distribution to approximate the