Not Answered
Construct a boxplot for the given data. Include values of the 5-number summary in all boxplots.
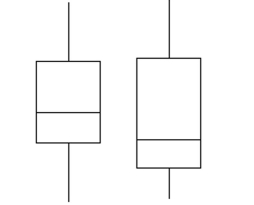
-Describe any similarities or differences in the two distributions represented by the following boxplots. Assume
the two boxplots have the same scale. 
Correct Answer:

Verified
Correct Answer:
Verified
Related Questions
Q76: Find the indicated measure.<br>-The test scores of
Q77: Construct a boxplot for the given
Q78: Find the number of standard deviations from
Q79: Use the empirical rule to solve the
Q80: Find the standard deviation for the
Q82: Find the midrange for the given
Q83: The race speeds (in minutes) for
Q84: Construct a boxplot for the given
Q85: Find the standard deviation for the
Q86: Find the coefficient of variation for