Multiple Choice
Construct a boxplot for the given data. Include values of the 5-number summary in all boxplots.
-The weights (in ounces) of 27 tomatoes are listed below.
A) Outliers: 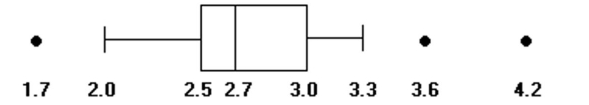
B) Outliers: 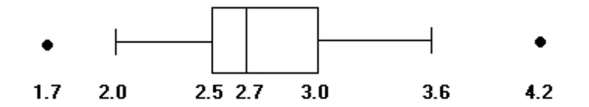
C) Outlier: 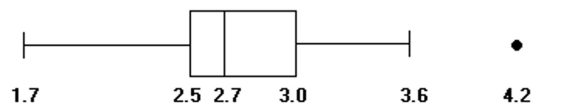
D) No outliers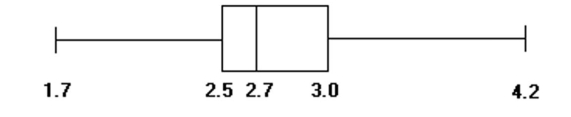
Correct Answer:

Verified
Correct Answer:
Verified
Related Questions
Q79: Use the empirical rule to solve the
Q80: Find the standard deviation for the
Q81: Construct a boxplot for the given data.
Q82: Find the midrange for the given
Q83: The race speeds (in minutes) for
Q85: Find the standard deviation for the
Q86: Find the coefficient of variation for
Q87: Find the coefficient of variation for
Q88: Find the range, variance, and standard
Q89: Approximately what percentage of apple diameters is