Multiple Choice
The frequency chart shows the distribution of defects for the machines used to produce a product. 
A) 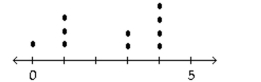
B) 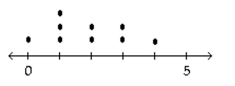
C) 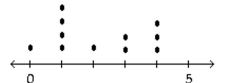
D) 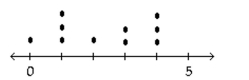
Correct Answer:

Verified
Correct Answer:
Verified
Related Questions
Q6: Suppose that a data set has a
Q31: A nurse measured the blood pressure of
Q33: In a survey, 20 people were
Q34: <span class="ql-formula" data-value="\begin{array}{c|c}\text { Weight (oz) }
Q35: Use the high closing values of
Q37: Suppose that a histogram is constructed
Q38: The histogram below represents the number of
Q39: Kevin asked some of his friends
Q40: Attendance records at a school show
Q41: Solve the problem.<br>-The Kappa Iota Sigma Fraternity