Multiple Choice
Attendance records at a school show the number of days each student was absent during the year. The days absent for each student were as follows.
A) 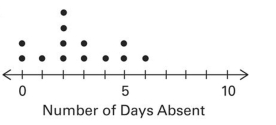
B) 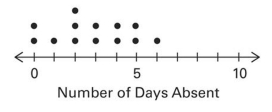
C) 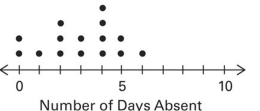
D) 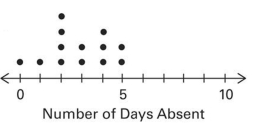
Correct Answer:

Verified
Correct Answer:
Verified
Related Questions
Q35: Use the high closing values of
Q36: The frequency chart shows the distribution
Q37: Suppose that a histogram is constructed
Q38: The histogram below represents the number of
Q39: Kevin asked some of his friends
Q41: Solve the problem.<br>-The Kappa Iota Sigma Fraternity
Q42: The histogram below represents the number of
Q43: The following frequency distribution analyzes the
Q44: The following frequency distribution analyzes the
Q45: The histogram below represents the number of