Multiple Choice
Use the data to create a stemplot.
-The following data show the number of laps run by each participant in a marathon.
A) 
B) 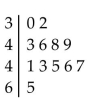
Correct Answer:

Verified
Correct Answer:
Verified
Related Questions
Q45: The histogram below represents the number of
Q46: The ages of the 45 members
Q47: The following data set represents Heather's
Q48: A nurse measured the blood pressure of
Q49: The following frequency distribution analyzes the
Q50: Explain in your own words why a
Q51: The frequency distribution below summarizes the
Q52: Using a strict interpretation of the
Q53: <span class="ql-formula" data-value="\begin{array}{lllllllllll}x & -1 & -4
Q55: The weights (in pounds) of 22