Multiple Choice
The histogram below represents the number of television sets per household for a sample of U.S. households. What is the sample size? 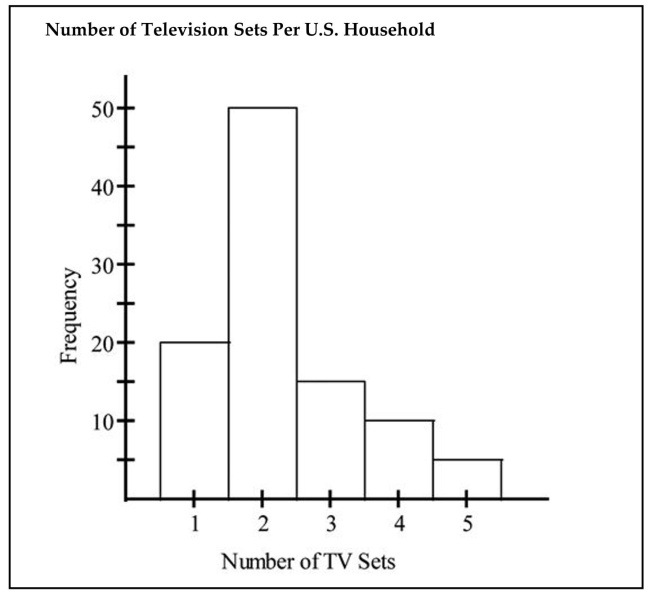
A) 5 households
B) 100 households
C) 50 households
D) 90 households
Correct Answer:

Verified
Correct Answer:
Verified
Related Questions
Q40: Attendance records at a school show
Q41: Solve the problem.<br>-The Kappa Iota Sigma Fraternity
Q42: The histogram below represents the number of
Q43: The following frequency distribution analyzes the
Q44: The following frequency distribution analyzes the
Q46: The ages of the 45 members
Q47: The following data set represents Heather's
Q48: A nurse measured the blood pressure of
Q49: The following frequency distribution analyzes the
Q50: Use the data to create a