Multiple Choice
Use the data to create a stemplot.
-Twenty-four workers were surveyed about how long it takes them to travel to work each day. The data below are given in minutes.
A) 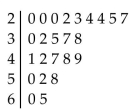
B)
Correct Answer:

Verified
Correct Answer:
Verified
Related Questions
Q4: Describe the differences between a histogram and
Q37: Define the difference between a Relative Frequency
Q79: The data shows the roundtrip mileage
Q80: Solve the problem.<br>-At the National Criminologists
Q81: A store manager counts the number
Q83: Attendance records at a school show
Q86: The following figures represent Latisha's monthly
Q87: The frequency distribution below summarizes the
Q88: The following frequency distribution depicts the
Q89: Use the data to create a