Multiple Choice
Solve the problem.
-At the National Criminologists Association's annual convention, participants filled out a questionnaire asking what they thought was the most important cause for criminal behavior. The tally was as follows. 
Construct a Pareto chart to display these findings.
A) 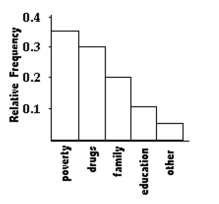
B) 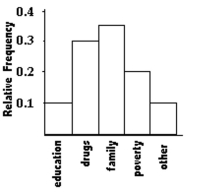
C) 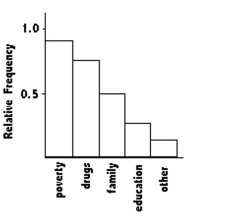
D) 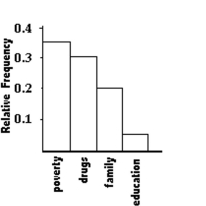
Correct Answer:

Verified
Correct Answer:
Verified
Related Questions
Q4: Describe the differences between a histogram and
Q37: Define the difference between a Relative Frequency
Q75: The attendance counts for this season's
Q76: The histogram below represents the number of
Q77: Use the data to create a
Q78: Which choice displays the best graphic
Q79: The data shows the roundtrip mileage
Q81: A store manager counts the number
Q83: Attendance records at a school show
Q84: Use the data to create a