Multiple Choice
Construct a pie chart representing the given data set.
-After reviewing a movie, 500 people rated the movie as excellent, good, or fair. The following data give the rating distribution. 
A) 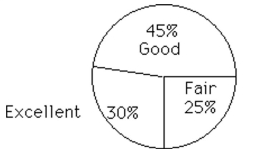
B) 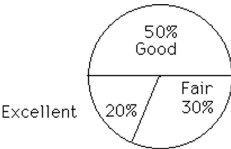
Correct Answer:

Verified
Correct Answer:
Verified
Related Questions
Q38: Solve the problem.<br>-Construct a frequency distribution and
Q119: The scatterplot below displays the amount
Q120: A nurse measured the blood pressure of
Q121: Wagenlucht Ice Cream Company is always trying
Q122: Use the high closing values of
Q123: The frequency table below shows the
Q125: Use the data to create a
Q126: Identify the cumulative frequency distribution that
Q127: The following data represent the number
Q129: Construct a pie chart representing the given