Essay
Construct an R chart and determine whether the process variation is within statistical control. 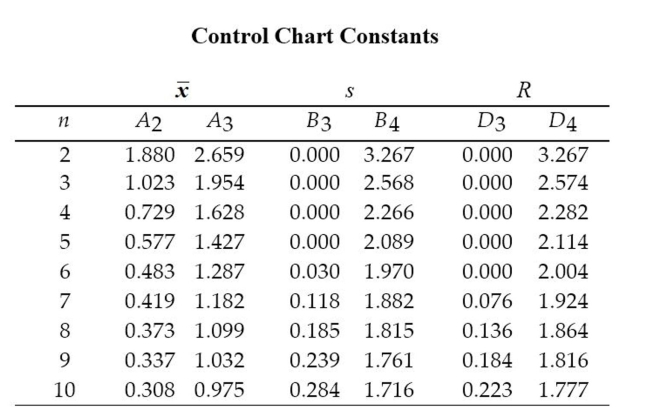 A machine is supposed to fill cans that contain 12 ounces. Each hour, a sample of four cans is tested; the results of 15
consecutive hours are given below. 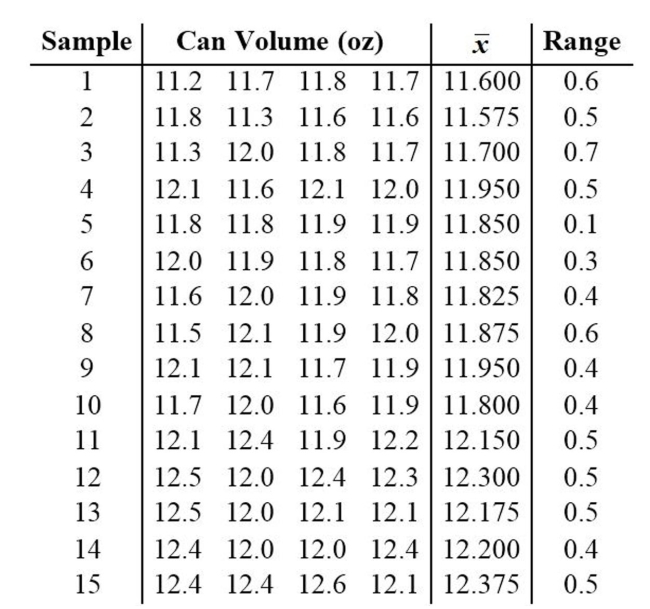
Correct Answer:

Verified
Correct Answer:
Verified
Q31: A control chart for <span
Q32: <img src="https://d2lvgg3v3hfg70.cloudfront.net/TB7898/.jpg" alt=" " class="answers-bank-image d-block" rel="preload"
Q32: Define statistically stable (or "within statistical control").
Q34: Use the given process data to
Q35: A _ is a sequential plot of
Q37: <img src="https://d2lvgg3v3hfg70.cloudfront.net/TB7898/.jpg" alt=" " class="answers-bank-image d-block" rel="preload"
Q38: If the weight of cereal in
Q40: <span class="ql-formula" data-value="\text { Construct an }
Q41: Examine the given run chart or control
Q52: Describe a run chart and give an