Essay
A control chart for is shown below. Determine whether the process mean is within statistical control. If it is not, identify which of the three out-of-control criteria lead to rejection of a statistically stable mean.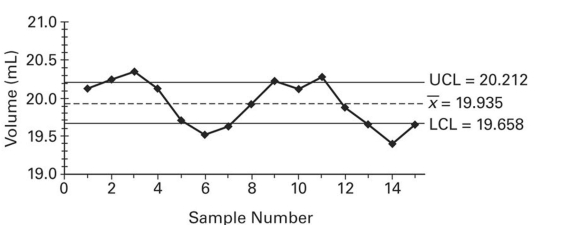
Correct Answer:

Verified
The process mean is not within...View Answer
Unlock this answer now
Get Access to more Verified Answers free of charge
Correct Answer:
Verified
View Answer
Unlock this answer now
Get Access to more Verified Answers free of charge
Q11: Solve the Problem.<br>-A control chart for attributes
Q27: A manufacturer of lightbulbs picks 10
Q28: Examine the given run chart or control
Q29: A control chart for R is shown
Q30: A machine that is supposed to fill
Q32: <img src="https://d2lvgg3v3hfg70.cloudfront.net/TB7898/.jpg" alt=" " class="answers-bank-image d-block" rel="preload"
Q34: Use the given process data to
Q35: A _ is a sequential plot of
Q36: Construct an R chart and determine whether
Q52: Describe a run chart and give an