Multiple Choice
The following scatterplot shows the percentage of the vote a candidate received in the 2004 senatorial elections according to the voter's income level based on an exit poll of voters conducted by CNN. The income levels 1-8 correspond to the
Following income classes: 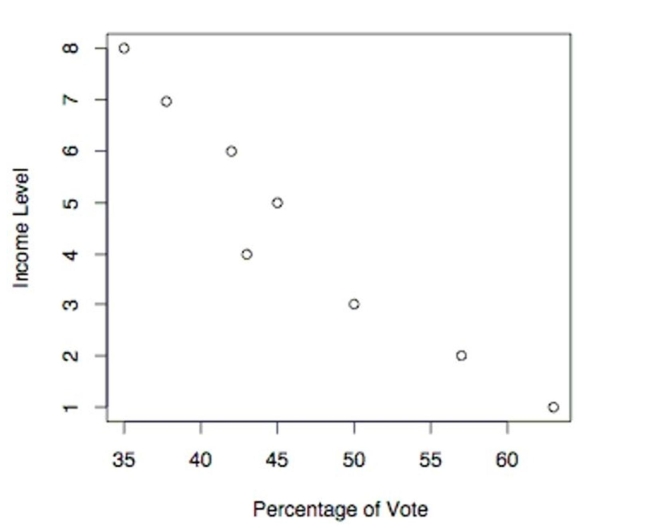 Use the election scatterplot to determine whether there is a correlation between percentage of vote and income level at
The 0.01 significance level with a null hypothesis of
A) The test statistic is not between the critical values, so we reject the null hypothesis. There is sufficient evidence to support a claim of correlation between percentage of vote and income level.
B) The test statistic is between the critical values, so we fail to reject the null hypothesis. There is no evidence to support a claim of correlation between percentage of vote and income level.
C) The test statistic is between the critical values, so we reject the null hypothesis. There is sufficient evidence to support a claim of correlation between percentage of vote and income level.
D) The test statistic is not between the critical values, so we fail to reject the null hypothesis. There is no evidence to support a claim of correlation between percentage of vote and income level.
Correct Answer:

Verified
Correct Answer:
Verified
Q26: Find the critical value. Assume that
Q28: An instructor gives a test before
Q29: Match the parametric test with its related
Q31: A teacher uses two different CAI programs
Q32: The following scatterplot shows the percentage
Q33: A sample of 30 clock radios
Q34: A researcher wishes to test whether a
Q35: In using the Kruskal-Wallis test, there
Q38: Describe the rank correlation test. What types
Q47: Describe the runs test for randomness. What