Multiple Choice
The following scatterplot shows the percentage of the vote a candidate received in the 2004 senatorial elections according to the voter's income level based on an exit poll of voters conducted by CNN. The income levels 1-8 correspond to the following income classes:
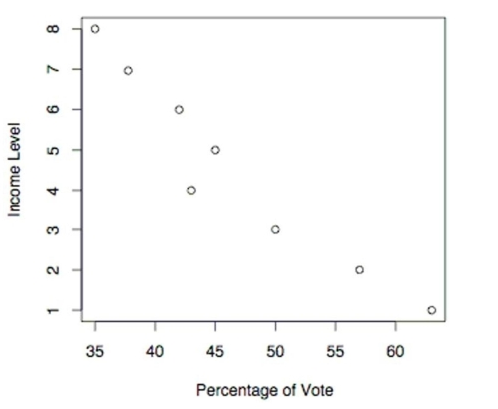
Use the election scatterplot to the find the critical values corresponding to a significance level used to test thi hypothesis of .
A)
B)
C) and
D) and
Correct Answer:

Verified
Correct Answer:
Verified
Q28: An instructor gives a test before
Q29: Match the parametric test with its related
Q30: The following scatterplot shows the percentage
Q31: A teacher uses two different CAI programs
Q33: A sample of 30 clock radios
Q34: A researcher wishes to test whether a
Q35: In using the Kruskal-Wallis test, there
Q36: The Wilcoxon signed-ranks test can be
Q37: Use a 0.05 level of significance
Q47: Describe the runs test for randomness. What