Essay
The following table gives the US domestic oil production rates (excluding Alaska) from 1987 to 2002. A
regression equation was fit to the data and the residual plot is shown below. 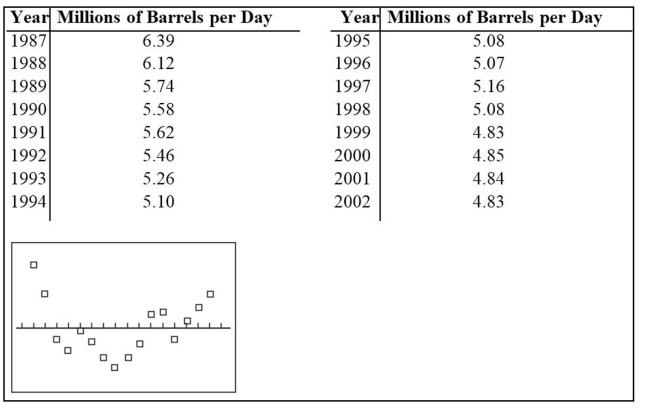 Does the residual plot suggest that the regression equation is a bad model? Why or why not?
Correct Answer:

Verified
Yes, the residual plot suggests that the...View Answer
Unlock this answer now
Get Access to more Verified Answers free of charge
Correct Answer:
Verified
View Answer
Unlock this answer now
Get Access to more Verified Answers free of charge
Q21: Solve the problem.<br>-A confidence interval for
Q22: Construct the indicated prediction interval for
Q23: Use the computer display to answer
Q24: Suppose you will perform a test
Q25: Construct a scatterplot and identify the
Q27: Find the indicated multiple regression equation.<br>-Below
Q28: Nine adults were selected at random from
Q29: Find the explained variation for the
Q30: Suppose you will perform a test
Q31: Construct the indicated prediction interval for