Essay
The following scatterplot shows monthly sales figures (in units) and number of
months of experience on the job for a sample of 19 salespeople. 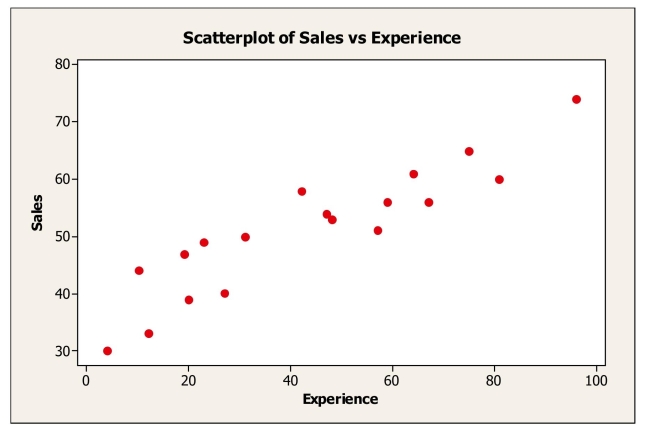 a.Describe the association between monthly sales and level of experience.
b.Do these data satisfy the conditions for computing a correlation coefficient? Explain.
c.Estimate the correlation.
Correct Answer:

Verified
a.Positive and strong.
b.Yes: variables ...View Answer
Unlock this answer now
Get Access to more Verified Answers free of charge
Correct Answer:
Verified
b.Yes: variables ...
View Answer
Unlock this answer now
Get Access to more Verified Answers free of charge
Q2: A study examined consumption levels of oil
Q13: Suppose the correlation, r, between two variables
Q14: A consumer research group examining the relationship
Q14: Suppose the correlation, r, between two variables
Q15: A company studying the productivity of their
Q21: Consider the following to answer the question(s)
Q21: Shown below is a correlation table showing
Q23: For each of the following scenarios, indicate
Q23: Data were collected on monthly sales revenues
Q24: The scatterplot shows monthly sales figures (in