Multiple Choice
The scatterplot shows monthly sales figures (in units) and number of months of experience for a sample of salespeople. 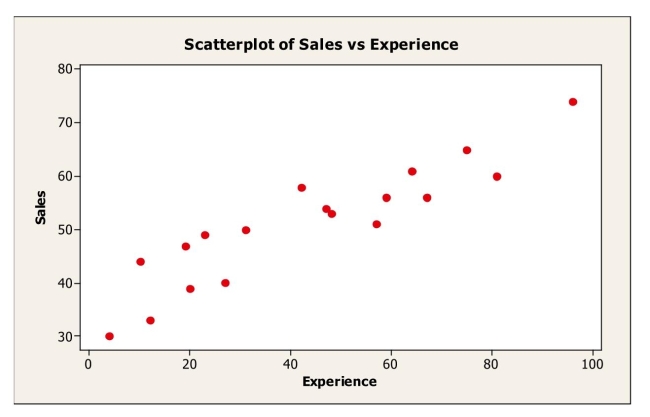
The association between monthly sales and level of experience can be described as
A) positive and weak.
B) negative and weak.
C) negative and strong.
D) positive and strong.
E) nonlinear.
Correct Answer:

Verified
Correct Answer:
Verified
Q2: A study examined consumption levels of oil
Q13: Suppose the correlation, r, between two variables
Q14: Suppose the correlation, r, between two variables
Q14: A consumer research group examining the relationship
Q15: A company studying the productivity of their
Q20: The following scatterplot shows monthly sales figures
Q21: Shown below is a correlation table showing
Q21: Consider the following to answer the question(s)
Q23: Data were collected on monthly sales revenues
Q23: For each of the following scenarios, indicate