Essay
Shown below is a correlation table showing correlation coefficients between stock
price, earnings per share (EPS), and price/earnings (P/E) ratio for a sample of 19 publicly
traded companies.
Correlations: Stock Price, EPS, PE 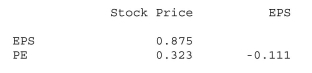 a.What is the correlation between stock price and EPS? Interpret.
b.What is the correlation between stock price and PE? Interpret.
c.What is the correlation between EPS and PE? Interpret.
Correct Answer:

Verified
a..875, positive and...View Answer
Unlock this answer now
Get Access to more Verified Answers free of charge
Correct Answer:
Verified
View Answer
Unlock this answer now
Get Access to more Verified Answers free of charge
Q6: The scatterplot shows monthly sales figures (in
Q7: A small independent organic food store offers
Q8: Data were collected on monthly sales revenues
Q11: Based on the following residual plot, which
Q12: Linear regression was used to describe the
Q13: Use the following to answer questions <br>To
Q14: A consumer research group examining the relationship
Q15: A company studying the productivity of their
Q17: Consider the following to answer the question(s)
Q19: A supermarket chain gathers data on the